NTT Platform Monitoring and Operations
Building an Archer solution until GoLive is part of being an administrator. Increasing amount of data over time, inter dependencies between solutions, or even issues in the environment’s infrastructure are important components of operating the solution. In addition, it does not matter how well designed or built the solutions are, if there are production issues on a regular basis, users lose trust in the platform. NTT designed a Platform Monitoring and Operations offering that contains the following parts: Platform Monitoring and Deep Dive Analysis.
On this page
Release history
Last updated: November 2020
Overview of Platform Monitoring and Operations
Key features and benefits
The Platform Monitoring part is an App-pack, enables the user to:
-
Monitor more than 20 individual parameters within your Archer environment related to datafeeds, schedules, system jobs, Advanced Workflow, search index, calculations, and more.
-
Receive automated alerts in case an issue is detected.
-
Create reports to see trends over time
-
Monitor critical parameters out-of-band
The Deep Dive Analysis part is a web application, enables the user to:
-
Analyze issues reported by the Platform Monitoring part or end users like:
-
Long-running calculation jobs
-
Outdated search index
-
-
Have a better understanding of your instance, for example:
-
Get details about where a particular field is referenced from
-
Statistics about history log data down to field level
-
With the NTT Platform Monitoring and Operations Tool & Utility, you can:
-
Closely monitor the health of your Archer environment.
-
Proactively identify issues that might have an impact on system integrity or availability.
-
Improve overall end user experience by reducing system down times or other issues in your production environment.
-
Reduce effort within operation teams by supporting analysis tasks.
Additional offerings
In addition to the App-Pack, NTT offers services to further support operations teams:
-
Guidance during initial setup of the Tool & Utility.
-
Update subscription covering new checks for the Platform Monitoring part and new scripts for the Deep Dive Analysis part
Prerequisites (and System Requirements)
|
Components |
Recommended Software |
|---|---|
|
ODA License(s) |
Platform Monitoring and Operations requires 1 ODA license. |
|
Archer |
Archer 6.6 P4 and later |
|
Prerequisite Required Use Cases |
Use case containing license to use questionnaires |
|
Optional Use Cases |
N/A |
Platform Monitoring and Operations components
Architecture diagram
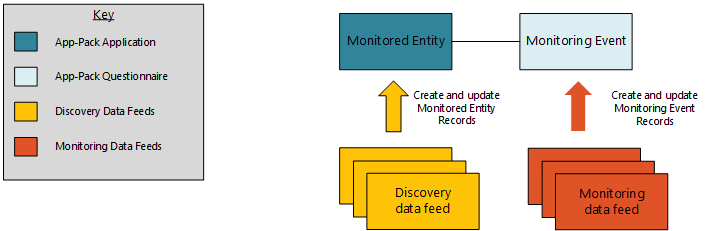
Applications and questionnaires
|
Application |
Description |
|---|---|
|
Monitored Entity |
The Monitored Entity application contains the configuration of the Platform Monitoring part. Users can configure parameters for each data feed, each data publication, each schedule and each system job type. |
|
Monitoring Event |
The Monitoring Event questionnaire contains all the events detected by the Platform Monitoring part for a particular Monitored Entity. |
Data feed types
|
Application |
Description |
|---|---|
|
Discovery |
Queries the Archer instance database for new entities that can later be integrated into the Platform Monitoring. Update names of existing entities. |
|
Monitoring |
Queries the Archer instance database based on parameters. Update existing event records if required. |
Personas and Access Roles
The following table describes the functions that make up the application’s organization roles. Depending on the functional roles of your organization, these functions and responsibilities may vary.
|
Function |
Description |
|---|---|
|
Configuration Admins |
Configures the Platform Monitoring part. |
|
Operations Managers |
Reviews events detected by the Platform Monitoring part. Analyses trends. |
|
Access Control Matrix |
|||||
|---|---|---|---|---|---|
|
Group/Application |
Monitored Entity |
Monitoring Event |
|||
|
Platform Monitoring: Configuration Admins |
RU |
R |
|||
|
Platform Monitoring: Operations Managers |
R |
RU |
|||
Additionally, technical roles/groups have been defined:
|
Function |
Description |
|---|---|
|
Platform Owners |
Operations and support role for the whole Archer Platform. |
|
Platform Monitoring: Module Owners |
Operations and Support role for the NTT Monitoring and Operations App-Pack. |
|
Platform Monitoring: Data Feeds |
Technical role for all data feeds. |
Note: Platform Owners and Platform Monitoring: Module Owners groups have been defined according to NTT’s best practice approaches for operational roles. Other Archer customers might have other approaches (seeTask 8 (if necessary): Adapt Platform Owner and Module Owner Groups).
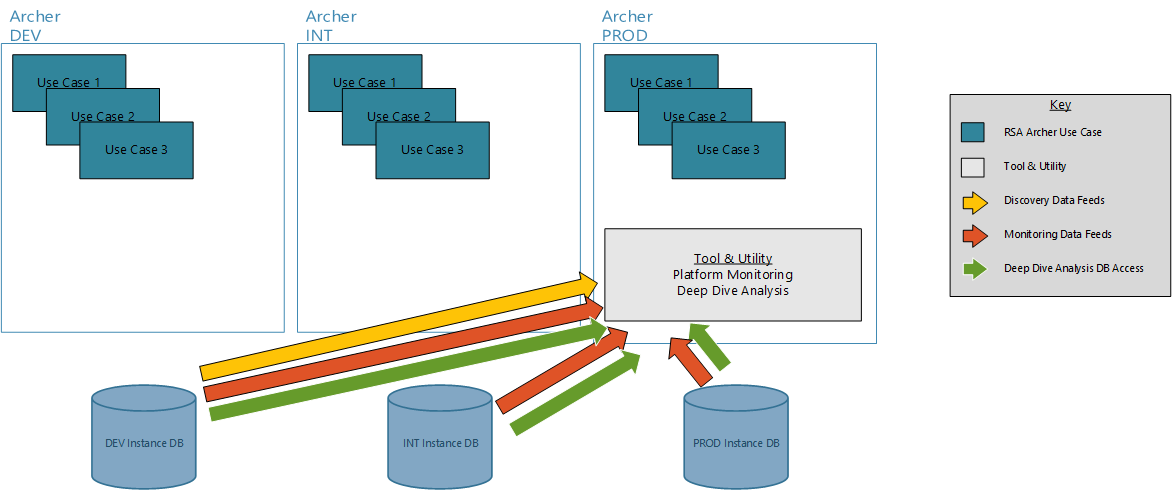
Architecture
Unlike for “classical” App-Packs or Archer Use Cases, Archer admins need to decide on a system architecture for the NTT Platform and Operations Tool & Utility. This includes the following aspects:
-
Which environment is the discovery environment for the Platform Monitoring part?
-
Which instance of the NTT Platform and Operations App-Pack monitors which environments of Archer?
-
Which Deep Dive Analysis instance of the NTT Platform and Operations Tool & Utility connects to which environments of Archer?
To leverage the full value of the solution, NTT recommends connecting all available environments to the production environment of the NTT Platform and Operations Tool & Utility. Please refer to the following figure that outlines this approach:
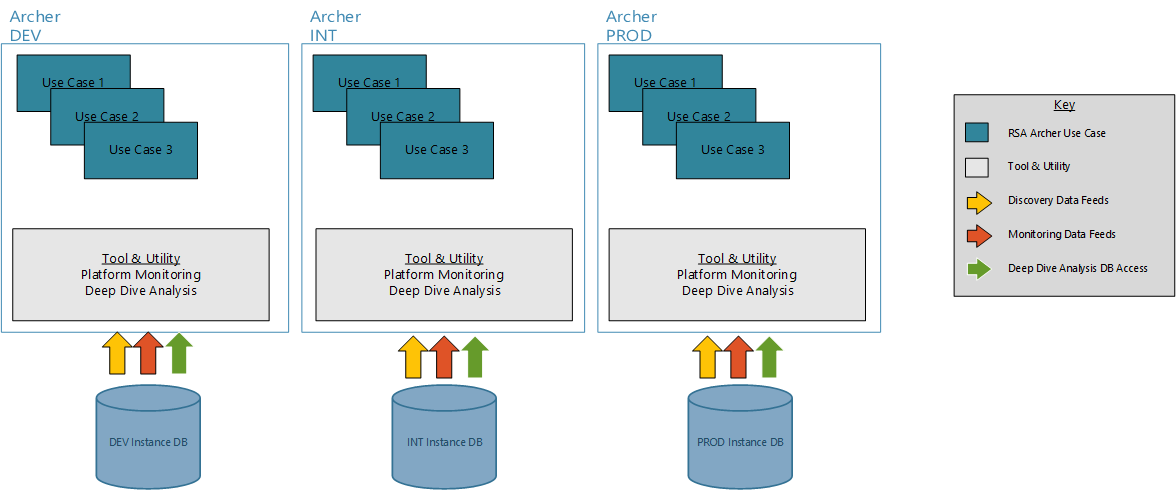
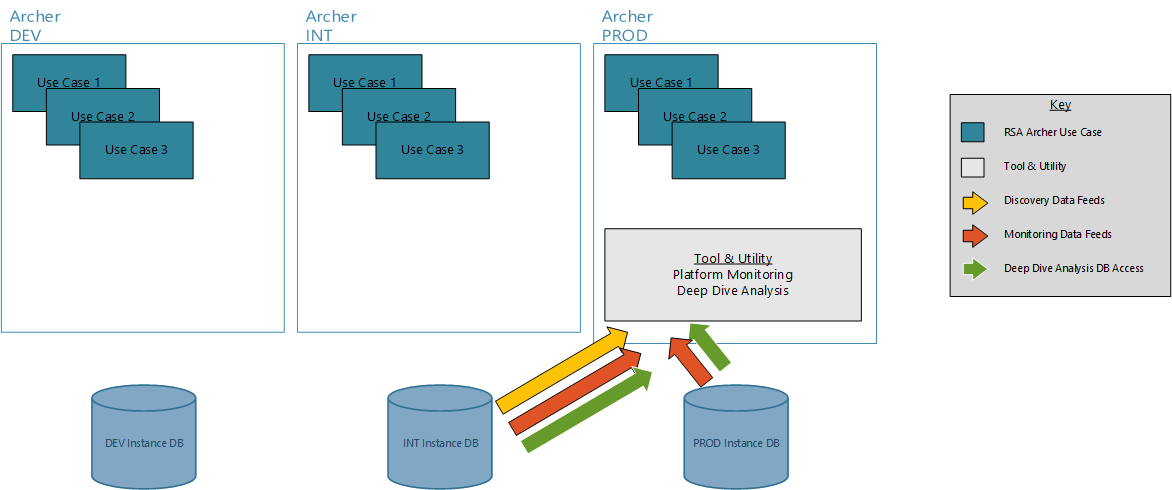
Due to customer specific constraints (security policies, network segmentation, team responsibility or release process), other setups might be more suitable. The following figures show other potential scenarios.
Scenario “Full Segregation”
Scenario “Isolated DEV”
Installing Platform Monitoring and Operations
Installation overview
Complete the following tasks to install the application.
Step 1: Prepare for the installation
-
Ensure that your Archer system meets the following requirements:
-
Archer Platform version 6.6 Patch 4.
-
-
Download the ODA install package from the Archer Exchange.
.
Step 2: Install the package
Installing a package requires that you import the package file, map the objects in the package to objects in the target instance and then install the package. See Install the Package for complete information.
Step 3: Set up data feeds
Import and schedule each use case data feed that you want to use. See Set Up Data Feeds for complete information.
Step 4: Install deep dive analysis part
The Deep Dive Analysis part is a separate .NET application. See Install Deep Dive Analysis Partfor complete information.
Step 5 (Optional): Install out of band monitoring
If there is an issue with the Job Engine in the instance the App-Pack is running in, Archer cannot create any Monitoring Events and therefore, the operations team will not receive alerts. To cover this scenario, the Platform Monitoring features an optional Out-of-Band Monitoring. See (Optional): Install Out-of-Band Monitoring for complete information.
Step 6 (Optional): Create notification
Out-of-the-box the App-Pack does not contain a notification to inform operations teams about a new event. See (Optional): Create Notification for complete information.
Step 7: Test the installation
Test the application according to your company standards and procedures, to ensure that the Tool & Utility works as expected.
Install the package
Task 1: Back up your database
There is no Undo function for a package installation. Packaging is a powerful feature that can make significant changes to an instance. Archer recommends backing up the instance database before installing a package. This process enables a full restoration if necessary.
An alternate method for undoing a package installation is to create a package of the affected objects in the target instance before installing the new package. This package provides a snapshot of the instance before the new package is installed, which can be used to help undo the changes made by the package installation. New objects created by the package installation must be manually deleted.
Task 2: Import the package
-
Go to the Install Packages page.
-
From the menu bar, click
 .
. -
Under Application Builder, click Install Packages.
-
-
In the Available Packages section, click Import.
-
Click Add New, then locate and select the package file that you want to import.
-
Click OK.
The package file is displayed in the Available Packages section and is ready for installation.
Task 3: Map objects in the package
Important: This step is required only if you are upgrading to a later version of Platform Monitoring and Operations.
-
In the Available Packages section, select the package you want to map.
-
In the Actions column, click
 for that package.
The analyzer runs and examines the information in the package. The analyzer automatically matches the system IDs of the objects in the package with the objects in the target instances and identifies objects from the package that are successfully mapped to objects in the target instance, objects that are new or exist but are not mapped, and objects that do not exist (the object is in the target but not in the source).
Note: This process can take several minutes or more, especially if the package is large, and may time out after 60 minutes. This time-out setting temporarily overrides any IIS time-out settings set to less than 60 minutes.
When the analyzer is complete, the Advanced Package Mapping page lists the objects in the package file and corresponding objects in the target instance. The objects are divided into tabs, depending on whether they are found within Applications, Solutions, Access Roles, Groups, Sub- forms, or Questionnaires.
-
On each tab of the Advanced Mapping Page, review the icons that are displayed next to each object name to determine which objects require you to map them manually.
|
Icon |
Name |
Description |
|---|---|---|
|
|
Awaiting Mapping Review |
Indicates that the system could not automatically match the object or children of the object to a corresponding object in the target instance. Objects marked with this symbol must be mapped manually through the mapping process. Important: New objects should not be mapped. This icon should remain visible. The mapping process can proceed without mapping all the objects. Note: You can execute the mapping process without mapping all the objects. The |
|
|
Mapping Completed |
Indicates that the object and all child objects are mapped to an object in the target instance. Nothing more needs to be done with these objects in Advanced Package Mapping. |
|
|
Do Not Map |
Indicates that the object does not exist in the target instance or the object was not mapped through the Do Not Map option. These objects will not be mapped through Advanced Package Mapping, and must be remedied manually. |
|
|
Undo |
Indicates that a mapped object can be unmapped. This icon is displayed in the Actions column of a mapped object or object flagged as Do Not Map. |
-
For each object that requires remediation, do one of the following:
-
To map each item individually, on the Target column, select the object in the target instance to which you want to map the source object. If an object is new or if you do not want to map an object, select Do Not Map from the drop-down list.
Important: Ensure that you map all objects to their lowest level. When objects have child or related objects, a drill-down link is provided on the parent object. Child objects must be mapped before parent objects are mapped. For more details, see "Mapping Parent/Child Objects" in Archer Help.
-
To automatically map all objects in a tab that have different system IDs but the same object name as an object in the target instance, do the following:
-
-
In the toolbar, click Auto Map.
-
Select an option for mapping objects by name.
Option
Description
Ignore case
Select this option to match objects with similar names regardless of the case of the characters in the object names.
Ignore spaces
Select this option to match objects with similar names regardless of whether spaces exist in the object names.
-
Click OK.
The Confirmation dialog box opens with the total number of mappings performed. These mappings have not been committed to the database yet and can be modified in the Advanced Package Mapping page.
-
Click OK.
-
To set all objects in the tab to Do Not Map, in the toolbar, click Do Not Map.
-
Note: To undo the mapping settings for any individual object, click ![]() in the Actions column.
in the Actions column.
When all objects are mapped, the ![]() icon is displayed in the tab title. The
icon is displayed in the tab title. The ![]() icon is displayed next to the object to indicate that the object will not be mapped.
icon is displayed next to the object to indicate that the object will not be mapped.
-
Verify that all other objects are mapped correctly.
-
(Optional) To save your mapping settings so that you can resume working later, see "Exporting and Importing Mapping Settings" in Archer Help.
-
Once you have reviewed and mapped all objects, click
 .
. -
Select I understand the implications of performing this operation and click OK.
The Advanced Package Mapping process updates the system IDs of the objects in the target instance as defined on the Advanced Package Mapping page. When the mapping is complete, the Import and Install Packages page is displayed.
Important: Advanced Package Mapping modifies the system IDs in the target instance. Any Data Feeds and Web Service APIs that use these objects will need to be updated with the new system IDs.
Task 4: Install the package
All objects from the source instance are installed in the target instance unless the object can not be found or is flagged to not be installed in the target instance. A list of conditions that may cause objects not to be installed is provided in the Log Messages section. A log entry is displayed in the Package Installation Log section.
-
Go to the Install Packages page.
-
From the menu bar, click
. -
Under Application Builder, click Install Packages.
-
-
In the Available Packages section, do the following:
-
Locate the package file you want to install.
-
In the Actions column, click
 .
.
-
-
In the Selected Components section, select the components of the package that you want to install.
-
To select all components, select the top-level checkbox.
-
To install only specific global reports in an already installed application, select the checkbox associated with each report that you want to install.
-
Note: Items in the package that do not match an existing item in the target instance are selected by default.
-
Click Lookup.
-
For each component section, do the following:
Note: To move onto another component section, click Continue or select a component section in the Jump To drop-down menu.
In the Install Method drop-down menu, select an install method for each selected component.
Note: If you have any existing components that you do not want to modify, select Create New Only. You may have to modify those components after installing the package to use the changes made by the package.
In the Install Option drop-down menu, select an install option for each selected component.
Note: If you have any custom fields or formatting in a component that you do not want to lose, select Do Not Override Layout. You may have to modify the layout after installing the package to use the changes made by the package.
-
Click OK.
-
To deactivate target fields and data-driven events that are not in the package, in the Post-Install Actions section, select the Deactivate target fields and data-driven events that are not in the package checkbox. To rename the deactivated target fields and data-driven events with a user-defined prefix, select the Apply a prefix to all deactivated objects checkbox, and enter a prefix. This can help you identify any fields or data-driven events that you may want to review for clean up post-install.
-
Click Install.
-
Click OK.
Task 5: Review the package installation log
-
Go to the Package Installation Log tab on the Install Packages page.
-
From the menu bar, click
. -
Under Application Builder, click Install Packages.
-
Click the Package Installation Log tab.
-
-
Click the package that you want to view.
-
In the Package Installation Log page, in the Object Details section, click View All Warnings.
Set up data feeds
Task 1: Create data feed user
-
Go to the Manage Users page.
-
From the menu bar, click
. -
Under Access Control, click Users.
-
-
Click Add New.
-
In the General Information section, enter the name of the user, the username for log on.
-
First Name: mon_A2A_min1
-
Last Name: Platform Monitoring
-
User Name: mon_A2A_min1
-
-
In the Account Maintenance section
-
Enter and confirm a password.
-
Uncheck ‘Force Password Change On Next Sign-In’
-
If you defined a separate Security Parameter for data feed users, select it.
-
-
On the Groups Tab, add ‘Platform Monitoring: Data Feeds’ by clicking on ‘Lookup’.
Task 2: Create SQL users in instance databases
-
In SQL Server Management Studio, navigate to Security > Logins, right-click and select “New Login”
-
Choose “SQL Server authentication”, enter login name and password and uncheck “Enforce password expiration”.
-
Click OK.
-
Navigate to Databases > Your Instance DB > Security > Users, right-click and select “New User”.
-
Select “SQL user with login” as User type and enter the login name of step 2 as User Name and Login Name.
-
Navigate to Membership and select “db_datareader”.
-
Click OK.
Repeat this task for each environment you want the Discovery and Monitoring data feeds to connect to.
Task 3: Configure discovery data feeds
The App-Pack comes with two sets of discovery data feeds:
-
Complete
-
Platform Monitoring - 1-Hour-1 - 001 - Monitored Entity - Discovery Create (DEV) – DB
-
Platform Monitoring - 1-Hour-1 - 002 - Monitored Entity - Discovery Update Master Data (DEV) – DB
-
-
Data Publication Only
-
Platform Monitoring - 1-Hour-1 - 003 - Monitored Entity - Discovery Create DP Only (INT) – DB
-
Platform Monitoring - 1-Hour-1 - 004 - Monitored Entity - Discovery Update Master Data DP Only (INT) – DB
-
For NTT recommended architecture (please refer to Architecture), setup the following data feeds by either renaming or copying out-of-the-box data feeds. Please refer to the appendix Data Feeds for a detailed description of the data feeds:
|
Datafeed |
Task |
|---|---|
|
Platform Monitoring - 1-Hour-1 - 001 - Monitored Entity - Discovery Create (DEV) – DB |
Optional: Rename data feed according to the name of your environment (DEV <yourName>) |
|
Platform Monitoring - 1-Hour-1 - 002 - Monitored Entity - Discovery Update Master Data (DEV) – DB |
|
|
Platform Monitoring - 1-Hour-1 - 003 - Monitored Entity - Discovery Create DP Only (INT) – DB |
Optional: Rename data feed according to the name of your environment (INT <yourName>) |
|
Platform Monitoring - 1-Hour-1 - 004 - Monitored Entity - Discovery Update Master Data DP Only (INT) – DB |
|
|
Platform Monitoring - 1-Hour-1 - 005 - Monitored Entity - Discovery Create DP Only (PROD) – DB |
|
|
Platform Monitoring - 1-Hour-1 - 006 - Monitored Entity - Discovery Update Master Data DP Only (PROD) – DB |
|
If you chose a different architecture:
-
Use the out-of-the-box data feeds 001 und 002 for the discovery environment.
-
Use the out-of-the-box data feeds 003 und 004 for one of the other environments that contains data publications.
-
Copy the box data feeds 003 und 004 to integration any additional environment that contains data publications.
-
Configure a convoy of data feeds by selecting the previous data feed as a reference for all data feeds from 002 onward.
Afterward, configure each data feed’s Transport tab according to your environment.
To complete this task, perform the following steps for each data feed:
-
Change the status to “Active” on the General tab and verify that the target is “Monitored Entity”.
-
Start the data feed by clicking on “Start” on the Schedule tab:
Task 4: Configure monitoring data feeds (DB)
For each environment the instance needs to connect to, one data feed has to be set up. The App-Pack comes with one out-of-the-box data feed:
-
Platform Monitoring - 0-Min-1 - 001 - Monitoring Events - Create and Update Events (DEV) – DB
If you want to monitor multiple environments, copy this data feed accordingly.
For NTT’s recommended architecture (please refer to Architecture), setup the following data feeds by either renaming or copying out-of-the-box data feeds.Please refer to the appendix Data Feeds for a detailed description of the data feeds:
|
Datafeed |
Task |
|---|---|
|
Platform Monitoring - 0-Min-1 - 001 - Monitoring Events - Create and Update Events (DEV) - DB |
Optional: Rename data feed according to the name of your environment (DEV à<yourName>) |
|
Platform Monitoring - 0-Min-1 - 002 - Monitoring Events - Create and Update Events (INT) - DB |
|
|
Platform Monitoring - 0-Min-1 - 003 - Monitoring Events - Create and Update Events (PROD) - DB |
|
If you chose a different architecture:
-
Use the out of the box data feed 001 for one of the environments.
-
Copy the data feed for each additional environment you want to monitor and rename accordingly.
-
Configure a convoy of data feeds by selecting the previous data feed as a reference for all data feeds from 002 onward.
Afterwards, configure each data feed’s Transport tab according to your environment:
To complete this task, perform the following steps for each data feed:
-
Change the status to “Active” on the General tab and verify that the target is “Monitoring Event”.
-
Enter the name of your environment as variable in the XSL on the Navigation tab:
-
Start the data feed by clicking on “Start” on the Schedule tab.
Task 5: Configure monitoring data feed to resolve events
This section refers to the following data feeds:
-
Platform Monitoring - 0-Min-1 - 099 - Monitoring Events - Set Resolved Helper - A2A
Refer to the appendix section Data Feeds for more information.
Repeat the following steps for each data feed:
-
Go to the Manage Data Feeds page.
-
From the menu bar, click
. -
Under Integration, click Data Feeds.
-
-
Select the data feed from the list.
-
From the General tab in the General Information section, in the Status field, select Activeand verify that the target is “Monitoring Event”.
-
Click the Transport tab. Update the fields as follows:
-
Security Section:
-
In the URL field, type: YourServerName/VirtualDirectoryName/
-
-
Transport Configuration Section:
-
In the User Name and Password fields, type the username and password of the user you created in Release history.
-
In the Instance field, type the name of the Platform instance in whichthe App-Pack has been installed.
-
-
-
Verify that key field values are not missing from the data feed setup window.
-
On the Schedule Tab, select the last Monitoring data feed in the convoy as reference.
-
Click Save.
Install deep dive analysis part
Task 1: Create a windows service account
Create a service user account in Active Directory (for example ,ARCHERDEMO\archer_monitoring_w). If all Archer services and the database run on the same Windows server, you may use a local windows account.
Task 2: Create windows users in instance databases
-
In SQL Server Management Studio, navigate to Security > Logins, right-click and select “New Login”
-
Choose “Windows authentication”, enter username.
-
Click OK.
-
Navigate to Databases <Your Instance DB > Security > Users, right-click and select “New User”.
-
Select “Windows User” as User type and enter the login name of step 3 as User name and Login Name.
-
Navigate to Membership and select “db_datareader”.
-
Click OK.
Repeat this task for each environment you want the Deep Dive Analysis part to connect to. The login has to be identical for all instance database connected to a particular instance of the Deep Dive Analysis part.
Task 3: Create application pool
-
In IIS Manager, navigate to Application Pools, right-click and select “Add Application Pool”.
-
Enter a name and click OK.
-
Select your application pool and click “Advanced Settings”.
-
Change the applications identity by clicking on “…” as shown below:
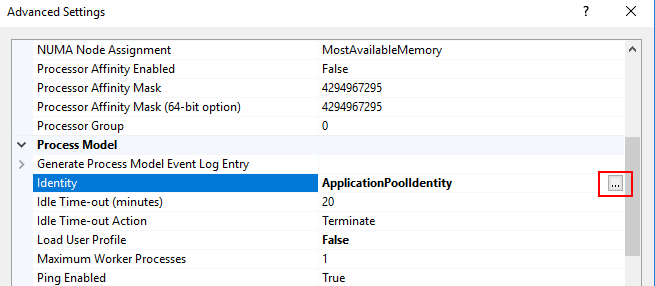
-
Enter the user’s (created in Task 1: Create a Windows Service Account) credentials and click OK.
-
Change the “Idle Time-out (minutes)” to 120.
-
Click OK.
Task 4: Copy application files
-
Copy the following files related to the Deep Dive Analysis part to a directory of your choice, for example, C:\inetpub\wwwroot\DeepDiveAnalysis.
Task 5: Create application
-
In IIS Manager, navigate to Sites, right-click Default Web Site and select “Add Application”
-
Enter an alias, choose the application pool created in Task 3: Create Application Pool, and enter the directory created in Task 4: Copy Application Files as physical path.
-
Click OK.
Task 6: Configure database access
-
Open the file Web.Config in the directory created in Task 4: Copy Application Files using a text editor.
-
In the section configuration/connectionStrings configure all instance databases in scope. The following figure shows an example:

Task 7: Configure access permissions
NTT recommends protecting the Application using IIS Authentication and authorization mechanisms. The following guideline is only one option. Contact your web server operations team to discuss best practices for your environment.
-
In IIS Manager, navigate to Sites > Default Web Site > DeepDiveAnalysis. Double Click on IIS/Authentication.
-
Only Windows Authentication should be enabled. If Windows Authentication is missing in your environment, install it at https://docs.microsoft.com/en-us/iis/configuration/system.webserver/security/authentication/windowsauthentication
-
Double click IIS/Authorization Rules. If Authorization Rules is missing in your environment, install it at https://docs.microsoft.com/en-us/iis/configuration/system.webserver/security/authorization
-
On the right side of the screen, click “Add allow rule”.
-
Create a rule based on your specific requirements, for example, by entering a list of authorized users or by entering an Active Directory group.
Task 8: Test
-
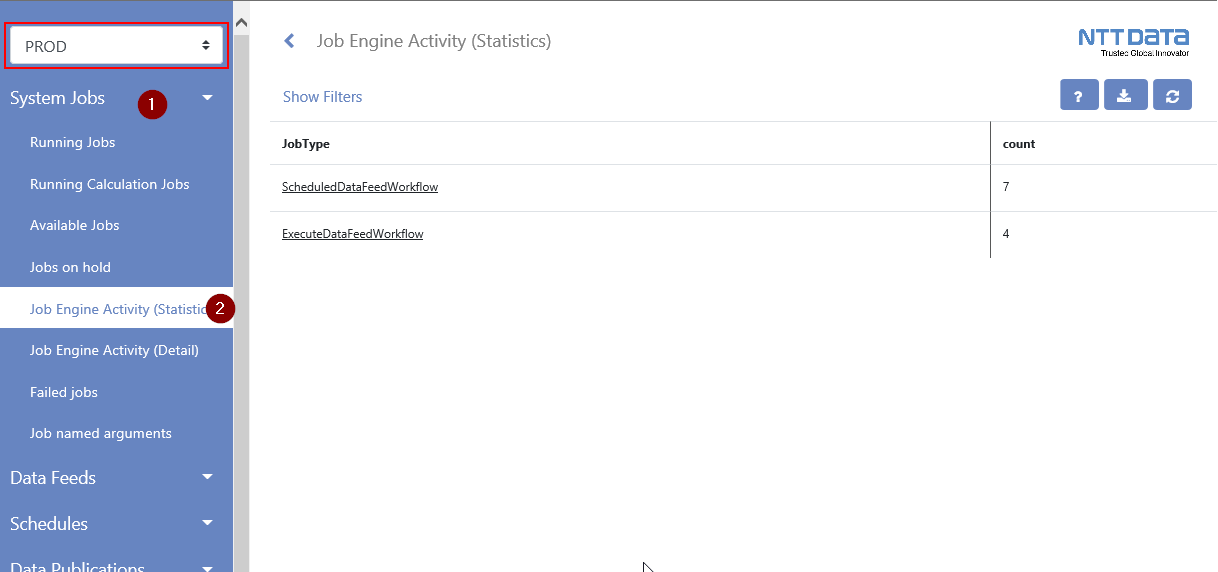
Using a browser, navigate to the Deep Dive Analysis application, https://yourserver/DeepDiveAnalysis. Verify that access to all environments works by selecting the System Jobs/Job Engine Activity (Statistics) Script.
-
If everything works as expected, backup your Web.config file.
Task 9: Update link on operations dashboard
-
Navigate to the Operations Dashboard.
-
Click “…” on the Operations Links iView and select Edit Properties.
-
In the Configuration Section click the little pen next to Deep Dive Analysis.
-
Enter the URL of your Deep Dive Analysis application and click Add.
-
Click OK twice.
(Optional): Install out-of-band monitoring
NTT’s out-of-band monitoring is based on a PowerShell script that executes an SQL query against each instance running the Tool & Utility. For NTT’s recommended architecture (please refer to Architecture), would have one instance of the out-of-band monitoring, the scenario “Full Segregation” has three instances. You can install multiple instances in separate directories on one server or on separate servers.
NTT recommends monitoring each monitoring data feed out-of-band. However, you can also monitor any other data feed using NTT’s out-of-band monitoring.
Task 1: Set data feed token
The SQL script for the out-of-band monitoring is static. In order to select data feeds in scope, configure one or multiple of the following token on the Source Definition/Tokens Tabs:
-
MonitorLastStartTime
-
MonitorCurrentRunDuration
-
MonitorLastRunFaulted
-
MonitorLastRunWarning
-
MonitorLastRunRecordCount
The parameters work similar to the parameters of the regular monitoring, so please refer to Task 1: Configure Data Feed Parameters for details.
The out-of-the-box Monitoring data feed (Platform Monitoring - 0-Min-1 - 001 - Monitoring Events - Create and Update Events (DEV) - DB) already comes with NTT’s recommended settings.
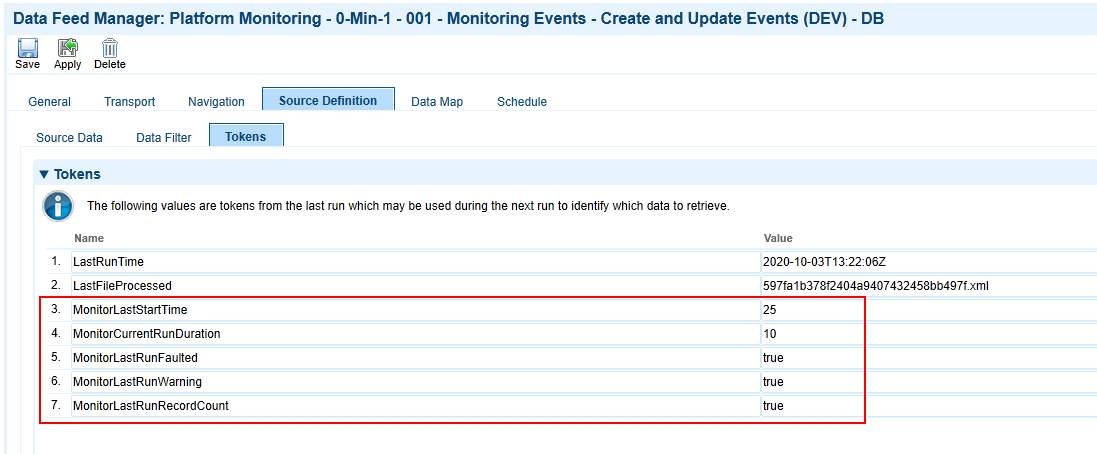
If you copied the data feed to cover additional environments or if you want to include additional data feeds, verify that the settings are correct.
Task 2 (if necessary): Install MS SQL Server Feature Pack
If neither MS SQL Server Management Studio nor MS SQL Server Feature Pack has been installed on the system you want to run the out-of-band monitoring on, please install MS SQL Server Feature Pack. You can download it from Microsoft.
Task 3: Copy files to windows server
Copy the following files to a directory of your choice, such as D:\monitoring:
|
File |
Description |
|---|---|
|
Archer_Monitor_Environment_Vars.ps1 |
Environment specific settings (e.g. database and email) |
|
Archer_Monitor_Main.ps1 |
The script doing the work |
|
SQL.txt |
The monitoring script |
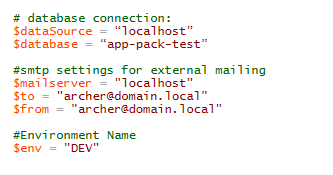
Task 4: Configure database and mail server settings
Configure the following parameters according your environment by editing Archer_Monitor_Environment_Vars.ps1:
|
Parameter |
Description |
|---|---|
|
datasource |
Database server instance (e.g. hostname or hostname\instance) |
|
database |
Database name |
|
mailserver |
Host address of the mail server |
|
to |
Recipient email address |
|
from |
Sender email address |
|
env |
Environment Name (will be placed in the email subject) |
The following figure shows an example:
Task 5: Create windows task
-
Grant the windows user created as part of Step 4: Install Deep Dive Analysis Part the permission to logon as batch job in Local Security Policy (secpol.msc)
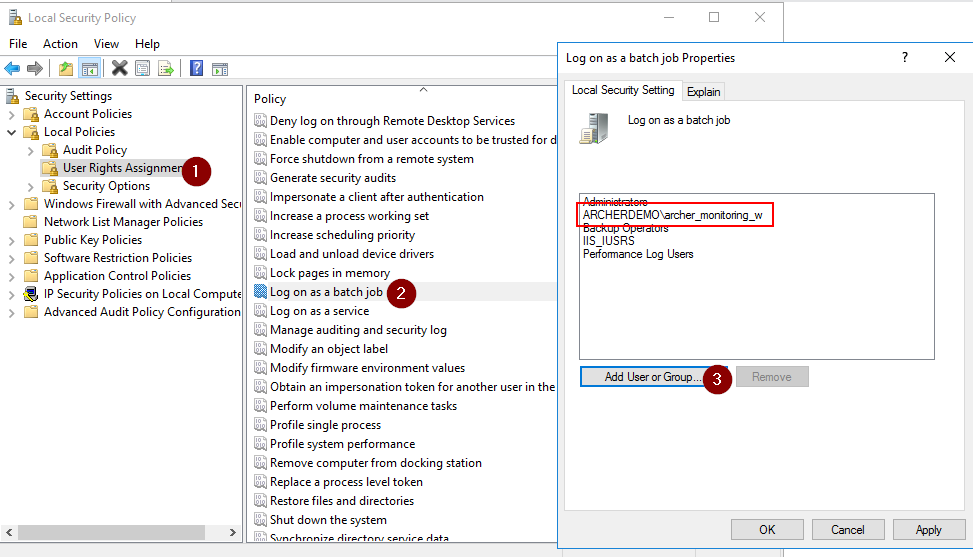
-
In Windows, open Computer Management.
-
Navigate to System Tools >Task Scheduler, right-click Task Scheduler Library and select “Create Task”
-
Configure a name, change user account to the windows user created as part of Step 4: Install Deep Dive Analysis Part by clicking on Change User or Group, and select “Run whether user is logged on or not”.
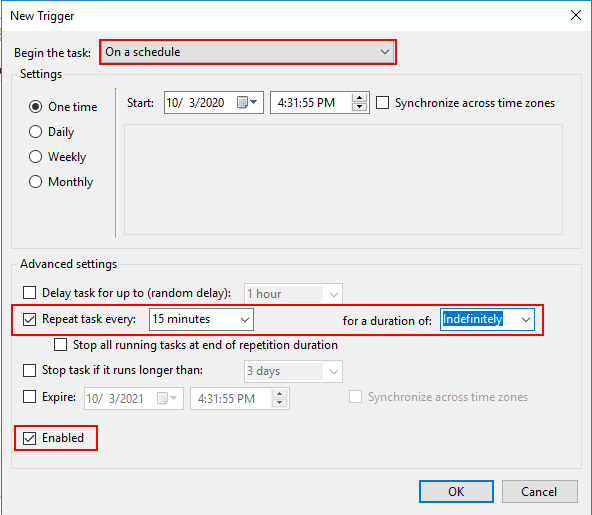
-
On the Triggers Tab, click New.
-
Configure the schedule as shown below:
-
On the Actions Tab, click New.
-
Select “Start a program”, enter powershell.exe as Program/Script and enter
“-file <your_path>\Archer_Monitor_Main.ps1”
( “-file D:\monitoring\Archer_Monitor_Main.ps1”) -
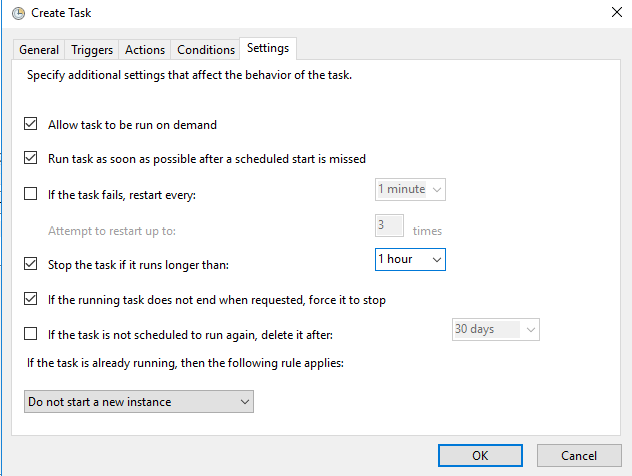
On the Settings tab change settings as shown below:
-
Click OK and enter the user’s credentials.
Task 6: Test
To test the monitoring, configure the MonitorLastStartTime token of one of the data feeds as zero. Then run the windows task manually and check your emails. Afterward, reset the token to the previous value.
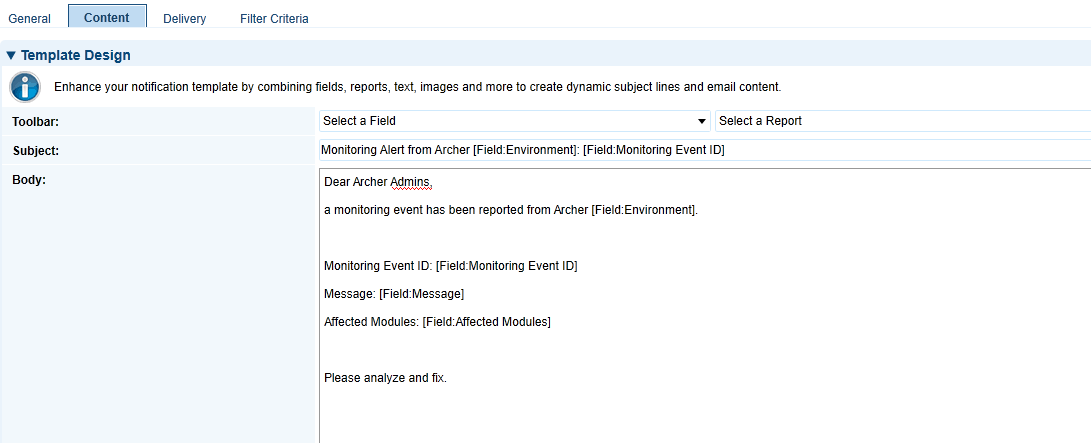
(Optional) Create notifications
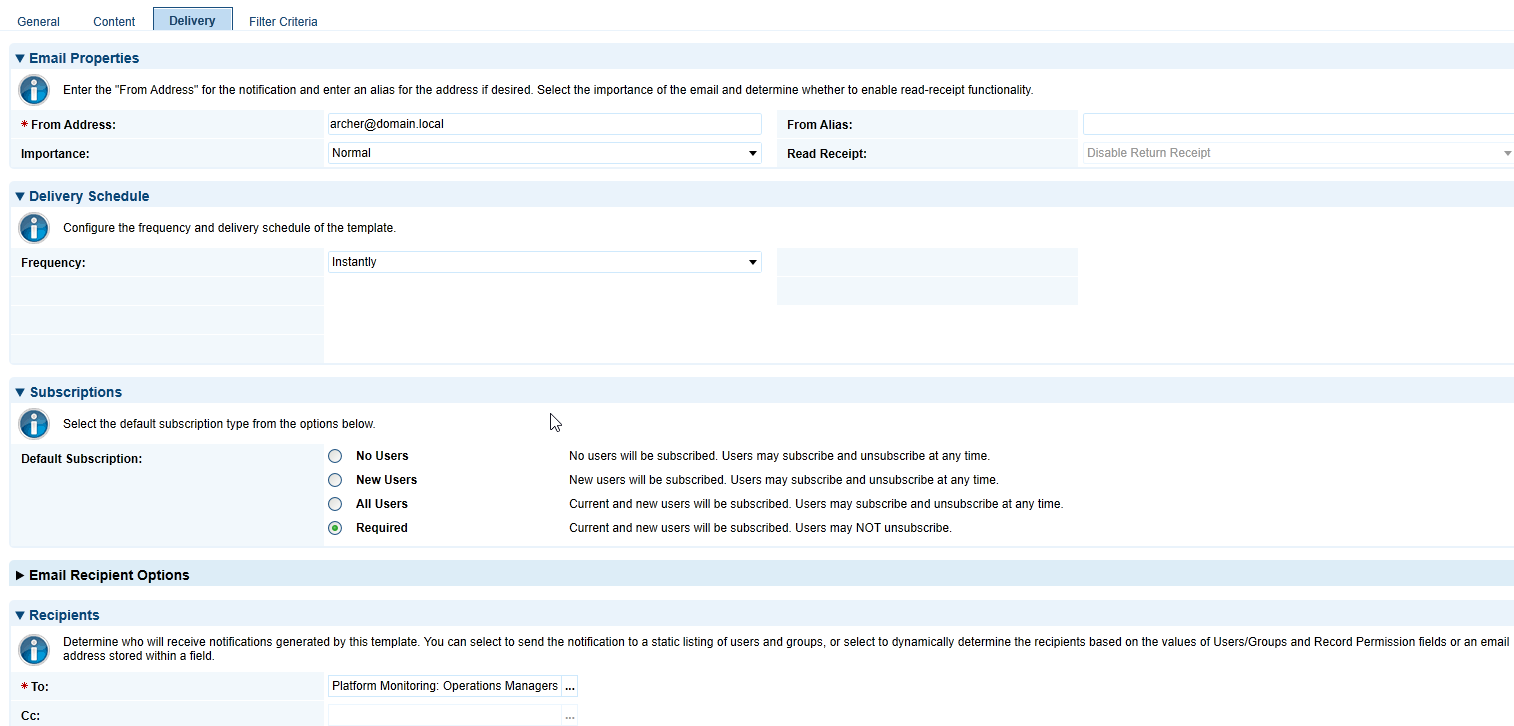
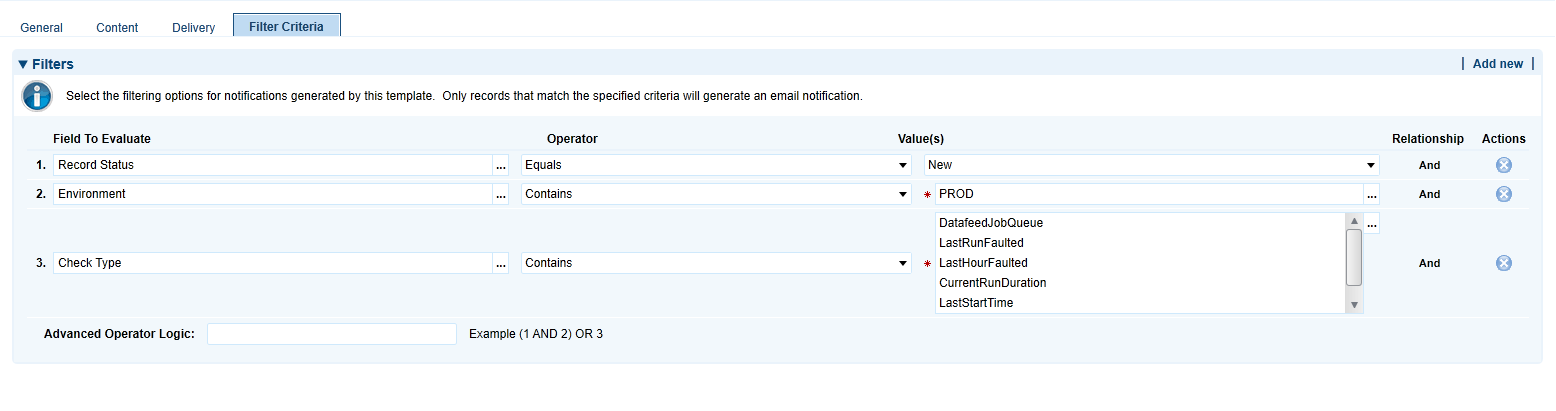
To simplify future updates, the App-Pack comes without any notifications. Based on your specific needs, you can add these easily using out-of-the-box Archer mechanisms. For example:
-
Create a notification instantly for critical events reported from PROD environment.
-
Create a daily summary of all events reported from PROD environment.
-
Create a weekly summary of all events reported from INT environment.
All notifications target the Monitoring Event questionnaire. The following figures show an example of a subscription notification to report critical events from PROD environment to the Operations Managers group:
Configure the Platform Monitoring Part
Task 1: Configure data feed parameters
-
On the Configuration Dashboard, select “Manage Data Feed Monitoring” from the Configuration Links iView. The report contains all the data feeds found by the discovery data feed in your discovery environment.
-
Review all data feeds and change the settings according to your requirements using inline edit:
|
Field |
Description |
|---|---|
|
Status |
(1) Draft: Records are listed in the inbox on the configuration dashboard, but not in scope for monitoring script. (2) Active: Records are in scope for monitoring. (3) Deprecated: Records are not in scope for monitoring. |
|
Modules |
Select from the list of Modules. A module can be an Archer or a custom use case. Users in the Configuration Admins group have the permission to modify the list. The module is also listed with each event to help the operations team evaluate the business impact of the event. |
|
Data Feed Is Active |
Select the status of the data feed in your environments. The discovery data feeds pre-fills this field. |
|
Data Feed Monitoring Type |
Select “App-Pack” if you want to include this data feed in the App-Pack monitoring. Select “Out of Band” if you want to include this data feed in the out-of-band monitoring. |
|
DF LastStartTime |
If the number of minutes from the last start time exceeds this value, Archer raises a monitoring event. |
|
DF CurrentRunDuration |
If the number of minutes of the current run exceeds this value, Archer raises a monitoring event. |
|
DF LastRunFaulted |
If this data feed completes as “Faulted”, Archer raises a monitoring event. |
|
DF LastRunWarning |
If this data feed completes as “Warning”, Archer raises a monitoring event. |
|
DF LastRunRecordCount |
Archer counts the number of source records and compares this value with the number of records created, deleted, failed and updated. If there is a discrepancy, Archer raises a monitoring event. |
|
Personal Watchlist |
Select your user to include this Monitored Entity in your personal watch list on the Configuration Dashboard. |
-
Click “Save Changes”
-
Select Options > Enable Bulk Update
-
Change the Data Feed Type to “Monitoring” for all your Monitoring Data Feeds and to “Monitoring (Discovery)” for all your Discovery Data Feeds.
Task 2: Configure schedule parameters
-
On the Configuration Dashboard, select “Manage Schedule Monitoring” from the Configuration Links iView. The report contains all the schedules found by the discovery data feed in your discovery environment.
-
Review schedules and change the settings according to your requirements using inline edit:
|
Field |
Description |
|---|---|
|
Status |
Draft: Records are listed in the inbox on the configuration dashboard, but not in scope for monitoring script. Active: Records are in scope for monitoring. Deprecated: Records are not in scope for monitoring. |
|
Modules |
Select from the list of Modules. A module can be an Archer or a custom use case. Users in the Configuration Admins group have the permission to modify the list. The module is also listed with each event to help the operations team evaluate the business impact of the event. |
|
SD LastStartTime |
If the number of minutes from the last start time exceeds this value, Archer raises a monitoring event. |
|
SD LastRunFaulted |
If this schedule completes as “Faulted”, Archer raises a monitoring event. |
|
Personal Watchlist |
Select your user to include this Monitored Entity in your personal watchlist on the Configuration Dashboard. |
-
Click “Save Changes”
Task 3: Configure data publication parameters
-
On the Configuration Dashboard, select “Manage Data Publication Monitoring” from the Configuration Links iView. The report contains all the data publications found by the discovery data feeds in any environment.
-
Review data publications and change the settings according to your requirements using inline edit:
|
Field |
Description |
|---|---|
|
Status |
Draft: Records are listed in the inbox on the configuration dashboard, but not in scope for monitoring script. Active: Records are in scope for monitoring. Deprecated: Records are not in scope for monitoring. |
|
Modules |
Select from the list of Modules. A module can be an Archer or a custom use case. Users in the Configuration Admins group have the permission to modify the list. The module is also listed with each event to help the operations team evaluate the business impact of the event. |
|
DP LastStartTime |
If the number of minutes from the last start time exceeds this value, Archer raises a monitoring event. |
|
DP LastRunFaulted |
If this data publication completes as “Faulted”, Archer raises a monitoring event. |
|
DP LastRunWarning |
If this data publication completes as “Warning”, Archer raises a monitoring event. |
|
Personal Watchlist |
Select your user to include this Monitored Entity in your personal watch list on the Configuration Dashboard. |
-
Click “Save Changes”
Task 4: Configure System Job Parameters
-
On the Configuration Dashboard, select “Manage System Job Monitoring” from the Configuration Links iView. The report contains all the system jobs within Archer. NTT provided default values for all parameters.
-
Review system jobs and change the settings according to your requirements using inline edit.:
|
Field |
Description |
|---|---|
|
Status |
Draft: Records are listed in the inbox on the configuration dashboard, but not in scope for monitoring script. Active: Records are in scope for monitoring. Deprecated: Records are not in scope for monitoring. |
|
Modules |
Select from the list of Modules. A module can be an Archer or a custom use case. Users in the Configuration Admins group have the permission to modify the list. The module is also listed with each event to help the operations team evaluate the business impact of the event. |
|
SJ LastStartTime |
If the number of minutes from the last start time exceeds this value, Archer raises a monitoring event. |
|
SJ CurrentRunDuration |
If the number of minutes of the current run exceeds this value, Archer raises a monitoring event. |
|
SJ LastHourFaulted |
If this system job completes as “Faulted”, Archer raises a monitoring event. |
|
SJ NumberJobsAvaiable |
If the number of system jobs in the job queue exceeds this number, Archer raises a monitoring event. |
|
SJ NumberJobsRunning |
If the number of system jobs running exceeds this number, Archer raises a monitoring event. |
|
Personal Watchlist |
Select your user to include this Monitored Entity in your personal watchlist on the Configuration Dashboard. |
-
Click “Save Changes”
Task 5: Configure instance parameters
-
On the Configuration Dashboard, select “Manage Instance Monitoring” from the Configuration Links iView. The report contains only one record. NTT provided default values for all parameters.
-
Review and change the settings according to your requirements using inline edit:
|
Field |
Description |
|---|---|
|
Status |
Draft: Records are listed in the inbox on the configuration dashboard, but not in scope for monitoring script. Active: Records are in scope for monitoring. Deprecated: Records are not in scope for monitoring. |
|
Modules |
Select from the list of Modules. A module can be an Archer or a custom use case. Users in the Configuration Admins group have the permission to modify the list. The module is also listed with each event to help the operations team evaluate the business impact of the event. |
|
IN SearchIndexQueueLength |
If the number of messages in the queue for indexing exceeds this value, Archer raises a monitoring event. |
|
IN SearchIndexQueueMaxAge |
If the age of the oldest message in the queue for indexing is older than this value (number of minutes), Archer raises a monitoring event. |
|
IN NumberJobsAvaiable |
If the number of system jobs in the job queue exceeds this number, Archer raises a monitoring event. |
|
IN NumberJobsRunning |
If the number of system jobs running exceeds this number, Archer raises a monitoring event. |
|
IN AdvancedWorkflowErrors |
If an advanced workflow enters an error state, Archer raises a monitoring event. |
|
IN CalcErrors |
If calculations return an error, Archer raises a monitoring event. |
|
IN DatafeedJobQueue |
If an active data feed not configured to be part of a convoy does not have an active schedule, Archer raises a monitoring event. |
|
IN FailedNotifications |
If notifications fail, Archer raises a monitoring event. |
|
IN DatabaseTableSize |
If the size of any database table exceeds the threshold (in GB), Archer raises a monitoring event. |
|
Personal Watchlist |
Select your user to include this Monitored Entity in your personal watch list on the Configuration Dashboard. |
-
Click “Save Changes”
Task 6: Export SQL script and update monitoring data feeds
-
Navigate to the Configuration Dashboard. The table shown in the iView Export "Platform Monitoring" Script summarizes the number of active entities for each entity type.
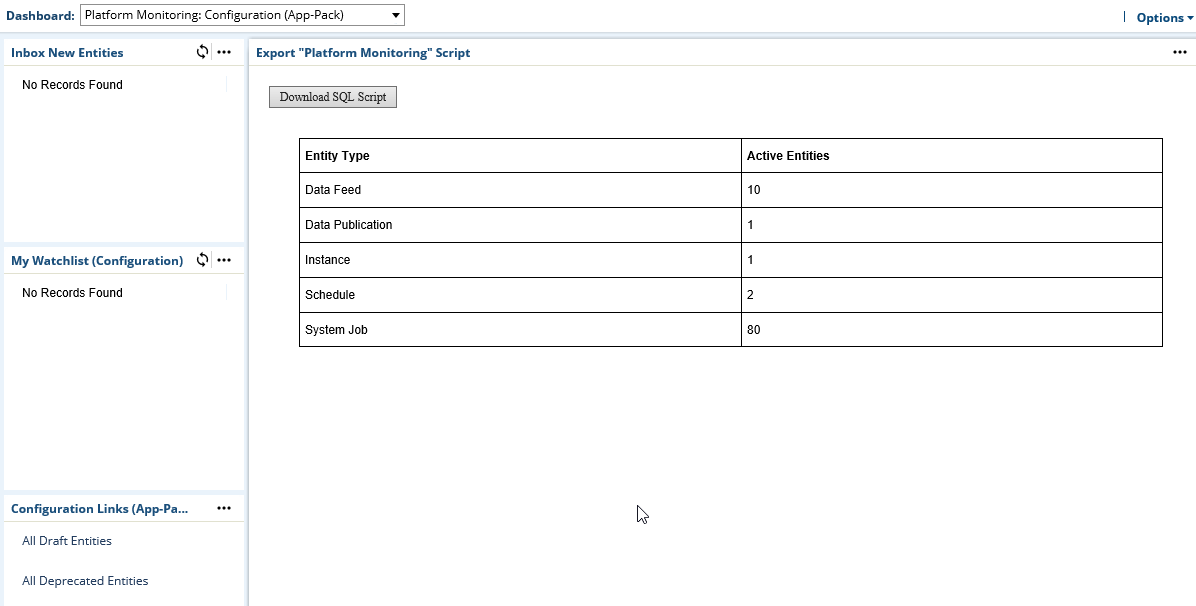
-
Click Download SQL Script and save the file.
-
Open the file with a text editor (for example, notepad) and copy the whole content into your clipboard.
-
Navigate to each Monitoring data feed as configured during Task 4: Configure Monitoring Data Feeds (DB) and paste the content into the field Query on the Transport Tab and click Save.
Note: No changes to the configuration (Task 1 to Task 5) of the App-Packs Platform Monitoring part will be transferred to the Monitoring data feeds automatically. Therefore, you have to copy the new SQL script to all of the Monitoring data feeds before any change in a parameter is “live”.
Task 7: Improve continuously
The first set of rules for the Platform Monitoring part will most likely not produce always the expected results. The monitoring either will produce false positives or will not report all the issues you expect. Especially during the first weeks of using the App-Pack, check all the events created and review the configuration.
Task 8 (if necessary): Adapt platform owner and module owner groups
NTT built the App-Packed following its Implementation Best Practices. One of these is to define operational and support groups already during implementation. Because most Archer customers have multiple GRC processes (NTT calls them Modules) hosted in one Archer environment, NTT’s Best Practice is to define:
-
Platform Owner Group and Role (supporting all Modules).
-
Module specific Owner Group and Role for each Module (supporting a particular Module).
Other Archer customers might have different Best Practices. These Groups and Roles are not necessary for the App-Pack to function. Adapt them according to your Best Practices or remove them.
-
Replace groups as:
-
Application Owners in all applications and questionnaires
-
Report Administrators in all applications and questionnaires
-
-
Replace groups in Access tab of:
-
All Dashboards
-
The Platform Monitoring Workspace
-
Using the Platform Monitoring Part
Operations dashboard
The Operations Dashboard shows all the information relevant for the Archer operations team to keep track of all the events currently open or to view trends over time.
|
iView |
Description |
|---|---|
|
My Watchlist |
Users can subscribe to monitoring events by adding their user to the Personal Watch list field. The reports contain all records, independent from their status. |
|
Operations Links |
Links to review the history of events and to navigate to the Deep Dive Analysis part of the App-Pack. |
|
Open Events |
List of events currently open. Additional reports group these open events e.g. by environment, affected module or entity type. |
|
Resolved Events (last 48 hours) |
List of events resolved within the last 48 hours. Additional reports group these open events by environment, affected module, or entity type. |
Comment on events
Operations teams can document actions taken to analyze or resolve an event by adding comments to comments field of an event.
Hide events
If an issue has been resolved, the Monitoring data feeds resolve the event automatically (if errors in calculations have been fixed or if a data feed completes successfully). However, some events cannot be resolved automatically:
-
FailedNotifications
-
AdvancedWorkflowErrors
By default, Archer will resolve these issues after seven days. During this time, the event is still open and is therefore part of the Open Events reports. Operations teams can remove these events from the lists by checking the Hide Event Checkbox in the General Information section of the eventand adding a comment.
Using the deep dive analysis part
Layout
NTT designed the Deep Dive Analysis part of the Tool & Utility to provide operations teams with an easy and efficient way to get detailed information about the health of their Archer environment that are not available in the Archer UI. It comes with a list of scripts.
The layout contains the following elements:
-
Environment Selector
-
List of Scripts
-
Script specific filters
-
Help icon with supporting information about the script
-
Export button to export the current result into a .CSV file
-
Refresh button to reload results
-
Result grid
-
Optional links to other scripts
List of scripts
The tables below gives an overview of the scripts currently available as well as typical scenarios where the information provided by the script would be helpful:
System jobs
|
Script / Parameters |
Description |
Scenario |
|---|---|---|
|
Running Jobs |
This script returns a list of all jobs currently running. |
The same lists are also available in the Archer Control Panel. Some operations teams may not have access to the Archer control panel, so they can gain access to this information here. |
|
Available Jobs |
This script returns a list of all jobs currently available. |
|
|
Jobs on hold |
This script returns a list of all jobs currently on hold. |
|
|
Running Calculation Jobs |
This script returns details related to all calculation jobs currently running. |
Sometimes hundreds of PhysicalCalculationsWorkflow system jobs block the job engine. This script provides operations teams valuable information so find out the root cause. |
|
Job Engine Activity (Statistics) - Last x Minutes |
This script returns the job engine activity grouped by job type. |
Get an idea of the overall activity of the job engine. |
|
Job Engine Activity (Detail) - Last x Minutes - Job Type |
This script returns the job engine activity related to a particular job type. |
Get details about the recent activity related to a particular job type. |
|
Failed jobs - Last x Minutes |
This script returns failed jobs with a defined timeframe. |
Details about failed jobs to analyze the root cause. |
|
Job named arguments - Job ID |
This script returns the named arguments of a specific job. |
Details about a specific job to analyze the root cause. |
Data feeds
|
Script / Parameters |
Description |
Scenario |
|---|---|---|
|
Datafeed token |
This script returns all data feeds including tokens (both Archer system token and token for NTT out-of-band monitoring). |
Get an overview of token set within data feeds. |
|
A2A Datafeed Overview |
This script returns all data feeds using the Archer Web service Transporter including URI and instance name. |
Quickly check settings of all data feeds. |
|
Data feed job queue |
This script returns all active data feeds that are not configured to run as a reference and do not have a corresponding schedule in the job queue. This script is also part of the continuous monitoring (Instance Monitoring --> IN DatafeedJobQueue). |
This can happen due to an error during data feed execution or if a data feed has been deployed as part of a package install and activated using the App-Pack's Data Feed Deployment Support Part. |
History log
|
Script / Parameters |
Description |
Scenario |
|---|---|---|
|
Changes to content - Last x Minutes - Field ID |
This script returns changes made to a particular field during the last x minutes. |
Analyze data integrity issues. |
|
History Log Statistics |
This script returns the number of history log rows for each field. |
Analyze growing database tables (in particular tblIVFieldHistory). |
Fields
|
Script / Parameters |
Description |
Scenario |
|---|---|---|
|
Calc Errors Statistic |
This script returns errors in calculated fields, grouped by Module, Level and Field. |
Analyze calculation errors. |
|
Calc Errors Details - Field ID |
This script returns errors related to a particular calculated field. |
Analyze calculation errors. |
|
Field Name - Field ID |
This script returns the name and the module for a specific field ID. |
In some cases, only the ID of a field is visible in an error or log message. This script helps to find out the name and application related to this ID. |
|
Field References - Field ID |
This script returns a list places where a particular field is used including calculations, DDE rules or actions, data feeds, reports. |
This helps to find out potential consequences if the configuration of a field is modified. |
Search index
|
Script / Parameters |
Description |
Scenario |
|---|---|---|
|
Search message queue by priority |
This script returns open entries in the search message queue grouped by priority. |
Analyze the health of the full text index. |
|
Search message queue by create date and time |
This script returns open entries in the search message queue grouped by date and time they have been created. |
|
|
Top 100 content in message queue |
This script returns up to 100 open entries in the search message queue. |
Misc
|
Script / Parameters |
Description |
Scenario |
|---|---|---|
|
Failed Notifications - Last x Minutes |
This script returns all failed notifications during the last x minutes. |
Analyze details about failed notifications. |
|
Top 100 Database Tables |
This script returns the 100 largest database tables. |
Get details about large database tables (related to history log) |
|
Schedule overview |
This script returns an overview of schedules in the instance including their status. |
|
|
Data Publication overview |
This script returns an overview of data publications in the instance including their status. |
|
Appendix
Data feeds
Platform Monitoring - 0-Min-1 - 001 - Monitoring Events - Create and Update Events (DEV) – DB
This data feed is the template for all monitoring data feeds. Out-of-the-box it does not contains a SQL query. Configuration admins have to copy the SQL script representing the currently valid configuration.
Platform Monitoring - 0-Min-1 - 099 - Monitoring Events - Set Resolved Helper - A2A
This data feed marks all existing Monitoring Events as resolved not having a corresponding row in any of the monitoring script results.
Platform Monitoring - 1-Hour-1 - 001 - Monitored Entity - Discovery Create (DEV) – DB
This data feed is the main discovery data feed. It creates new Monitored Entity records.
Platform Monitoring - 1-Hour-1 - 002 - Monitored Entity - Discovery Update Master Data (DEV) – DB
This data feed updates existing Monitored Entity records (e.g. if the name of a data feed changed).
Platform Monitoring - 1-Hour-1 - 003 - Monitored Entity - Discovery Create DP Only (INT) – DB
This data feed is the discovery data feed only covering data publications.
Platform Monitoring - 1-Hour-1 - 004 - Monitored Entity - Discovery Update Master Data DP Only (INT) - DB
This data feed updates existing data publication records in the Monitored Entity application.
Custom iViews
Export “Platform Monitoring” Script
The JavaScript in this iView queries Archer’s content API for the currently active configuration. By clicking on “Download SQL Script”, users can download the monitoring script representing this configuration.