Network Graphs
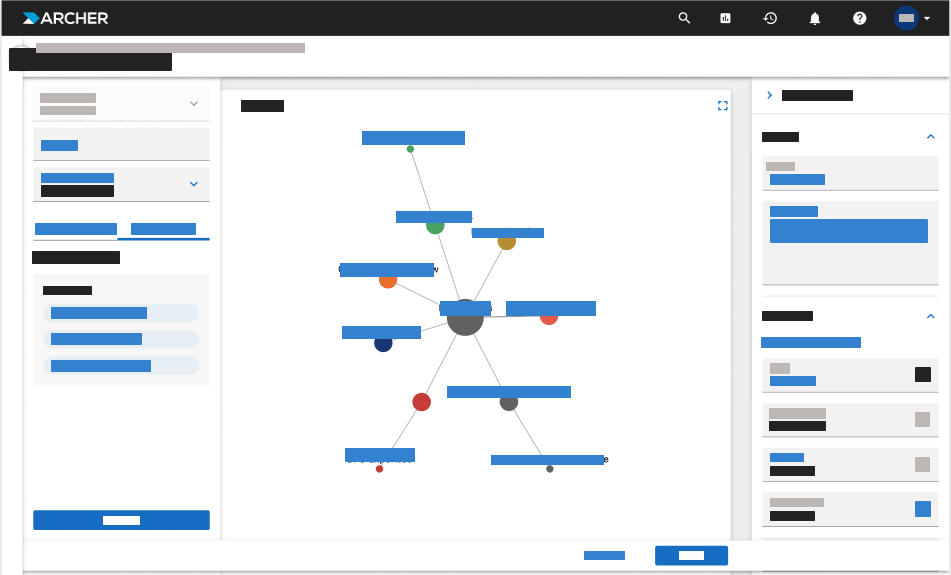
The Network Graph displays search results as an interactive diagram of networked data in the form of interconnected nodes, allowing you to visualize hierarchical relationships. The visualization is based on the selected Values List fields within a leveled application.
This view helps you better understand complex relationships within your data, providing both a visual hierarchy and easy navigation between related records.
In the initial view, the top-level records appear at the center of the diagram. Clicking a node allows navigation to the corresponding record for further exploration. The graph dynamically expands as you navigate through levels of data. When a path reaches its end, the node shape changes to indicate that no additional connections exist.
On this page
Advantages of using Network Graphs
-
Visual Hierarchy. Helps you understand how records are related by displaying up to 1000 records in a clear, layered structure.
-
Interactive Exploration. Allows you to expand or collapse nodes and navigate directly to related records for deeper analysis.
-
Relationship Clarity. Makes complex dependencies easier to interpret by showing how data elements connect within and across applications.
-
Dynamic Insights. Supports node color coding and customizable visuals, enabling users to highlight key categories or statuses at a glance.
-
Enhanced Decision-Making. Provides a extensive view of record relationships, improving visibility into patterns and data impact. Users can create, update an existing report, and save as a new copy of a network graph.
-
Ease of Navigation. Reduces the need to open multiple records or reports by visually linking them in one connected view.